
Long-term investors increased BTC sales due to the loss of a key level.
The daily sales volume of long-term holders of the leading cryptocurrency has increased from $1 billion in June to $3 billion in October. This group is exerting pressure on the price, according to experts at Glassnode.
“Unlike previous phases of high spending in the current cycle, this distribution mode has been gradual and steady, rather than abrupt,” they noted.
Investors who purchased Bitcoin at an average price of $93,000 between October 2024 and April 2025 have become the main sellers of the asset. The daily sales volume peaked at $648 million around the all-time high of $126,000, exceeding the baseline level by more than five times.
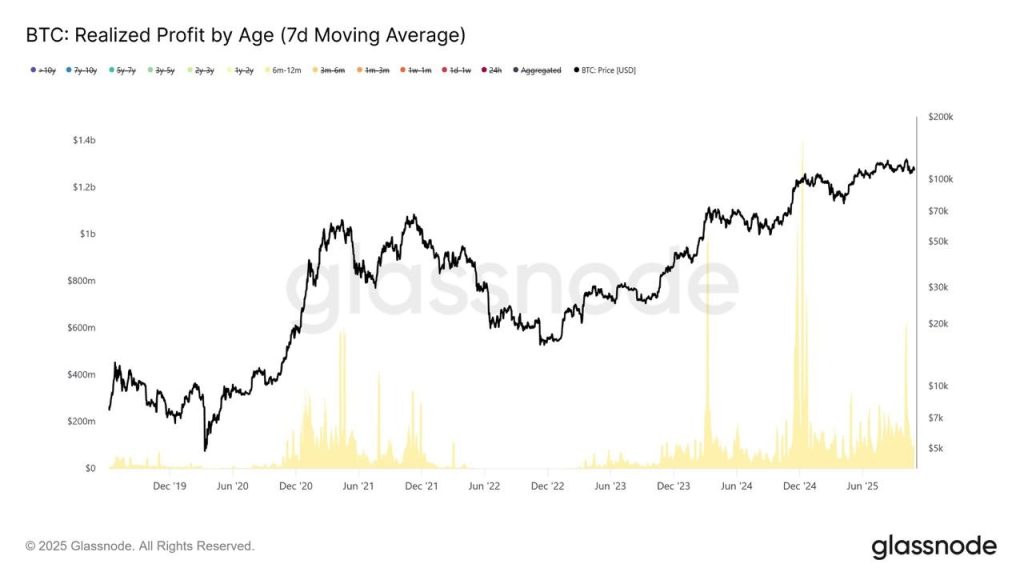

The group of coin holders aged six to 12 months accounted for more than 50% of the selling pressure, analysts emphasized.
Bitcoin Risks Falling Back to $88,000
According to experts, the $113,000 level currently serves as the dividing line between bearish and bullish sentiments. Bitcoin rose to this mark, but only briefly.
At the time of writing, the leading cryptocurrency is trading around $108,400.
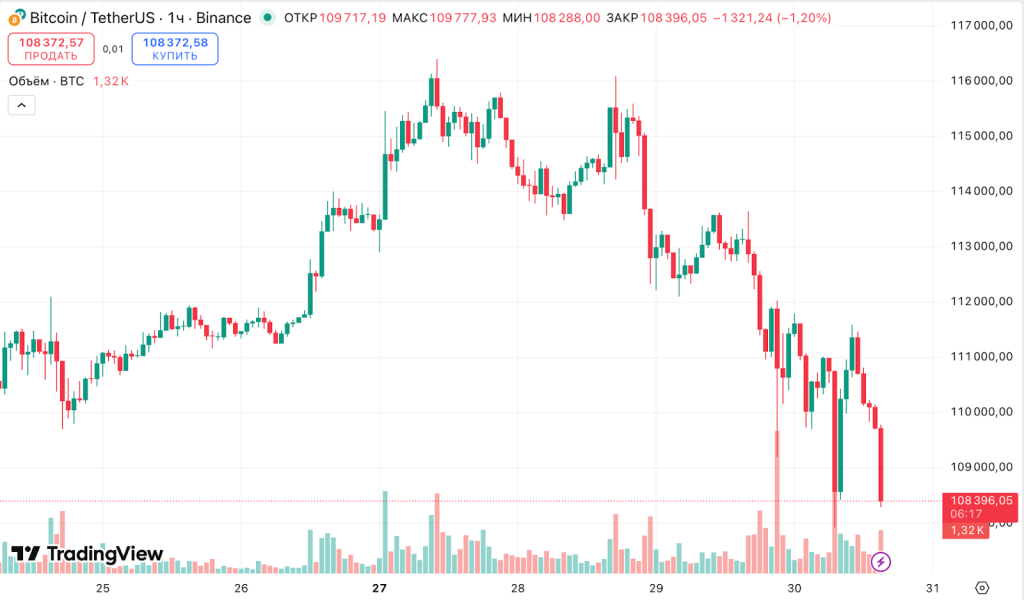

The inability to hold above $113,000 after six months of steady trading at high levels indicates a weakening of buying activity, noted Glassnode.
“Over the past two weeks, Bitcoin has failed to close a weekly candle above this significant threshold, increasing the risks of further correction,” the experts explained.
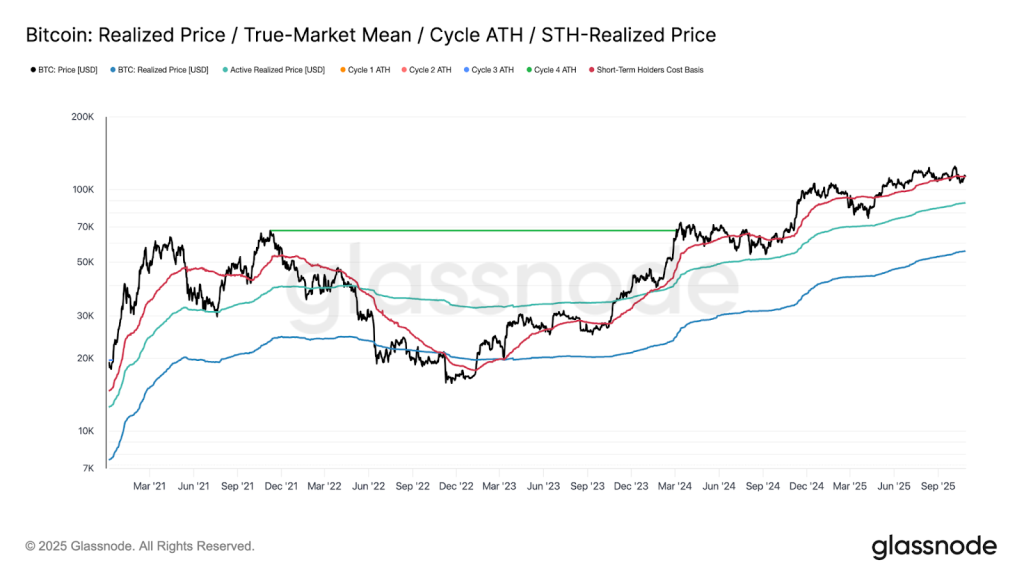
If the trend continues, a pullback to the next significant support around $88,000 — the realized price level of active investors — is possible. Historically, this indicator has often marked phases of deep corrections.

Future demand dynamics will depend on short-term holders. To quantitatively assess stress in this category, analysts used the STH-NUPL indicator, which measures the share of unrealized profit or loss in the total market capitalization.
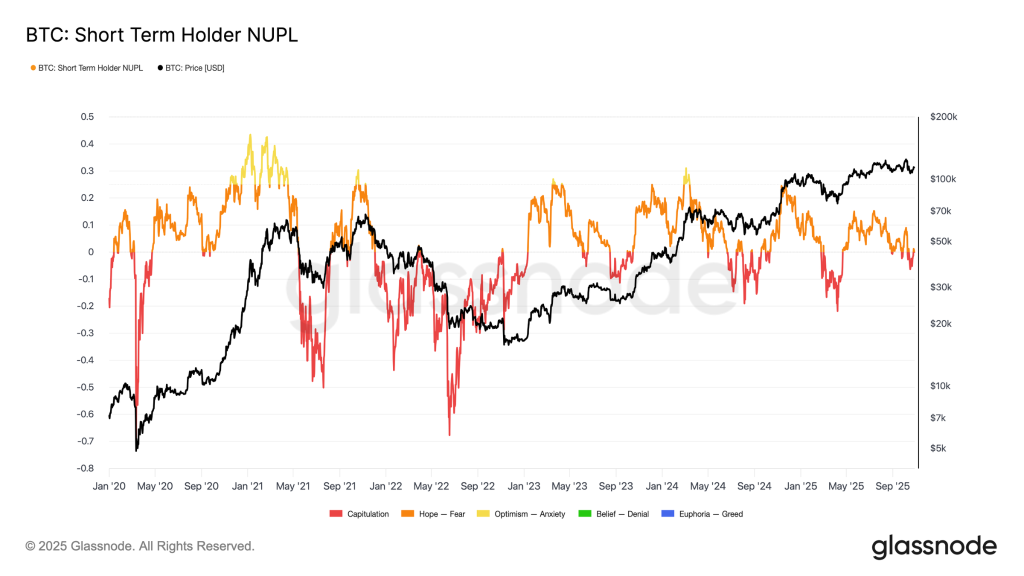

According to historical data, extremely low values of this indicator have traditionally coincided with capitulation phases preceding market bottoms.
The current decline in the leading cryptocurrency’s rate has lowered the STH-NUPL to -0.05. This indicates relatively moderate losses — for comparison, during average corrections in a bull trend, values usually reach -0.1/-0.2, while in deep bear phases, they fall below -0.2.
“As long as Bitcoin trades in the $107,000-117,000 range — the zone of concentration for major investors’ purchases — the market maintains a fragile equilibrium. Although full-scale capitulation has not yet been observed, time works against the bulls as market participants’ confidence gradually erodes,” Glassnode emphasized.
Earlier, an analyst under the pseudonym Crypto Dan predicted the end of the correction and the start of an altcoin rally.
Нашли ошибку в тексте? Выделите ее и нажмите CTRL+ENTER
Рассылки ForkLog: держите руку на пульсе биткоин-индустрии!


